Draft. Outline only. Write the post under these headings.
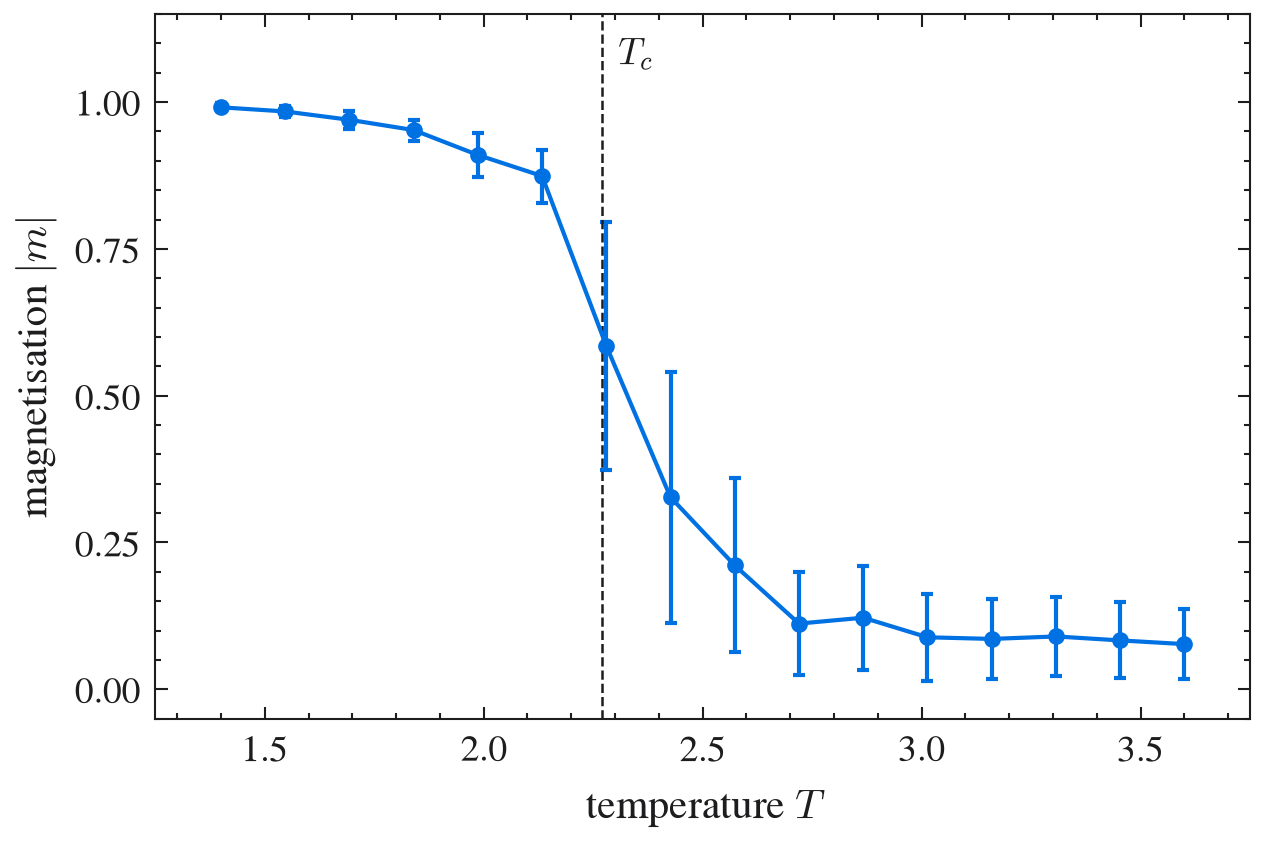
The phase transition, simulated. Mean absolute magnetisation of a 24×24 Ising lattice against temperature (checkerboard Gibbs sampling, 400 sweeps per point; bars show ±1 s.d.). The dashed line is the exact critical temperature $T_c \approx 2.269$.
Outline
The Boltzmann distribution: why $p(s) \propto e^{-E(s)/T}$
Gibbs sampling one spin at a time
Watching order appear below $T_c$
What this has to do with graphical models and SBMs